


HR metrics guide: How to track, measure and optimise your workforce data
Published
HR metrics guide: How to track, measure and optimise your workforce data
If you’re looking to grow your business, it’s important to understand where your business is performing well and where things can improve. In this article, we’re breaking down the HR metrics you need to track to understand your workforce. From demographics and hiring to performance, these numbers can help tell you the real story.
What’s included in this guide?
We’ve created this digital guide to take you through the key metrics and how to use them. In here, you’ll find:
- The essential groundwork before collecting metrics
- The performance indicators that you should be tracking
- How to avoid potential pitfalls as you go
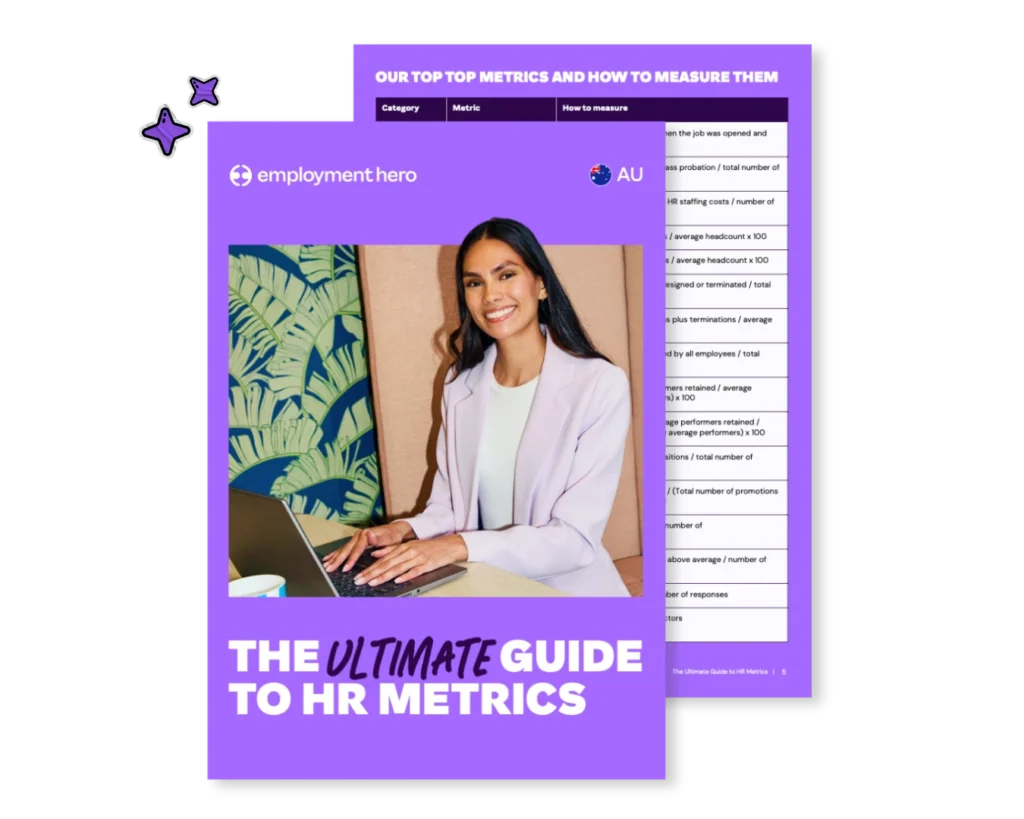
Download the guide to HR metrics by filling in the form on the right.
What are HR metrics?
HR metrics are quantifiable measures used to track, assess and improve how effectively an organisation manages its people. They turn day-to-day HR activity into data that can be analysed, compared and acted on.
HR metrics help answer questions like:
- How well are we attracting and retaining the right people?
- Where are we losing talent and why?
- Are our HR initiatives actually delivering value to the business?
Common HR metrics cover areas such as recruitment, retention, performance, engagement, learning and workforce costs. Examples include employee turnover rate, time to hire, absenteeism, headcount growth and probation success rates.
On their own, individual metrics are just numbers. Their real value comes from using them consistently, in context and alongside other data to spot trends, uncover issues and support better decision-making.
Categories of HR metrics
HR metrics are often grouped into categories to make workforce data easier to interpret and act on. Common categories include recruitment metrics (such as time to hire and cost per hire), retention metrics (like turnover and tenure) and talent and performance metrics that track development, capability and progression.
Other key categories include engagement (e.g. survey scores and participation), productivity and risk (absenteeism, overtime, safety and compliance indicators), diversity and inclusion (representation and pay equity) and ROI metrics that link people initiatives to business outcomes.

Why HR metrics matter
Without clear data, it’s hard to quantifythe real impact of HR initiatives, whether that’s a wellbeing program, a new hiring strategy or a retention effort. Conversations with senior leaders can quickly fall back on anecdotes, while emerging issues like rising turnover go unnoticed until they become costly problems.
Relying on gut instinct alone puts HR initiatives at risk of missing the mark. Having the right HR metrics change that. They provide early signals, clarify what’s driving workforce outcomes and empower HR teams to link people decisions directly to business performance.
Inform better decisions
HR metrics give leaders the evidence they need to make confident, informed decisions about people and performance. The data allows HR teams to clearly explain what’s happening across the workforce, why it’s happening and what action to take next.
When HR can link workforce trends to business outcomes such as productivity, retention or cost, conversations with leadership shift from reactive problem-solving to proactive, strategic decision-making.
Improve retention and engagement
How many hours have your HR teams spent on hiring processes that drag on for months, only to end with mediocre candidates or, worse, new hires who leave within weeks?
When you measure recruitment metrics properly, you discover which channels bring your best performers, how long your ideal hiring timeline should be and where qualified candidates are dropping out of your process.
Without this data, you’re essentially throwing money at recruitment, hoping something eventually works. Smart recruitment metrics mean every dollar spent on hiring delivers maximum return through better quality candidates and shorter time-to-productivity.
Align HR with business outcomes
Without connecting your human resources initiatives to concrete business results, you’re constantly fighting for budget and recognition.
When you establish clear links between HR data and business performance, everything changes. Suddenly, your wellness program is directly tied to reduced absenteeism and increased productivity.
Download the guide to HR metrics by filling in the form on the right.

Key HR metrics to track
There’s no shortage of HR metrics you could track, but high-performing organisations are selective. Instead of chasing vanity metrics, they focus on measures that clearly connect people decisions to business outcomes and employee experience.
While it’s easy to showcase surface-level indicators in reports, truly strategic HR teams prioritise metrics that inform action, guide investment and drive meaningful change.
Some of the most valuable HR KPIs include:
Voluntary turnover rate
Tracks the percentage of employees who choose to leave. When segmented by team, tenure or performance, it highlights where retention risks sit and where targeted action is needed.
Recruitment and time to fill
Shows how long it takes to hire for open roles. Extended timeframes can signal issues with recruitment processes, compensation competitiveness or employer brand.
Training effectiveness
Assesses whether learning and development initiatives lead to measurable improvements in skills, performance or outcomes.
Revenue per employee
A core productivity metric that links workforce capability directly to business performance and helps justify investment in people.
Diversity and inclusion metrics
Track representation, progression and equity across demographic groups, providing insight into whether talent strategies are supporting an inclusive and sustainable workforce.
Together, these metrics give HR teams the clarity needed to move from reporting activity to driving results.

HR metrics examples and formulas
Understanding HR metrics is one thing, but knowing how to calculate and use them is what matters. Below are some of the most commonly used HR metrics, along with simple formulas and why they matter.
Common HR metric examples and formulas
Employee turnover rate
Measures how many employees leave your organisation over a period of time.
Formula: (Number of employees who left ÷ average number of employees) × 100
Why it matters: Helps identify retention issues and workforce stability risks.
Voluntary turnover rate
Tracks employees who choose to leave (excluding redundancies or dismissals).
Formula: (Number of voluntary resignations ÷ average number of employees) × 100
Why it matters: Highlights avoidable attrition and employee experience issues.
Time to fill
Measures how long it takes to fill a vacant role.
Formula: Total days to fill all roles ÷ number of roles filled
Why it matters: Indicates recruitment efficiency and potential resourcing gaps.
Cost per hire
Calculates the total cost of recruiting a new employee.
Formula: (Total recruitment costs ÷ number of hires)
Why it matters: Helps evaluate recruitment ROI and budget effectiveness.
Employee Net Promoter Score (eNPS)
Measures employee advocacy and sentiment.
Formula: % promoters − % detractors
Why it matters: Provides a simple indicator of engagement and cultural health.
Revenue per employee
Shows how much revenue is generated per employee.Formula: Total revenue ÷ Total number of employees
Why it matters: Links workforce productivity directly to business performance.
Sample HR metrics table
| HR Metric | Definition | Formula | Why it matters |
|---|---|---|---|
| Employee turnover rate | Percentage of employees who leave over a period | (Leavers ÷ Avg headcount) × 100 | Identifies retention and stability issues |
| Voluntary turnover rate | Percentage of employees who resign voluntarily | (Voluntary exits ÷ Avg headcount) × 100 | Highlights avoidable attrition |
| Time to fill | Average time taken to fill open roles | Total days to fill ÷ Roles filled | Measures recruitment efficiency |
| Cost per hire | Total cost of hiring a new employee | Recruitment costs ÷ Hires | Assesses hiring ROI |
| eNPS | Employee advocacy score | % Promoters − % Detractors | Gauges engagement and culture |
| Revenue per employee | Revenue generated per employee | Revenue ÷ Employees | Indicates workforce productivity |
| Training effectiveness | Impact of learning on performance | Performance improvement ÷ Training investment | Validates L&D outcomes |
| Diversity representation | Workforce diversity by demographic | Group count ÷ Total employees | Tracks inclusion and equity |
How often should you measure HR metrics?
Different organisations need different cadences for their essential HR metrics. Here’s how to find that sweet spot that gives you actionable insights without drowning your team in constant number-crunching.
Small businesses
In small organisations where everyone knows each other by name, subtle shifts in team dynamics can have outsized impacts. A nimble approach works best:
- Monthly: Track your core metrics, like voluntary turnover rate and employee satisfaction, through quick pulse surveys. With fewer employees, each departure or disengagement has a proportionally larger effect on your operations.
- Quarterly: Conduct more comprehensive reviews of recruitment effectiveness and training impact. This gives you enough data points to spot meaningful patterns without overwhelming your likely small HR team.
- Annually: Complete a thorough analysis of compensation benchmarking and total rewards effectiveness. This timing aligns well with typical budget planning cycles in smaller organisations.
Medium businesses
At this size, you’re navigating the complex middle ground. You’re big enough to need systematic approaches but perhaps without the robust HR analytics resources of larger corporations:
- Bi-weekly: Monitor basic workforce metrics like headcount changes, current vacancies and time-to-fill for critical roles. This frequency helps you stay responsive during growth phases.
- Monthly: Review department-level engagement indicators, absence patterns and new hire performance. This cadence helps identify departmental issues before they spread.
- Quarterly: Conduct deeper dives into turnover reasons, recruitment channel effectiveness and learning program impact. This timing gives you enough data to make meaningful interventions.
- Bi-annually: Analyse compensation competitiveness, internal mobility patterns and diversity metrics. This schedule allows for mid-year corrections if needed.
Large organisations
With substantial employee populations and dedicated HR analytics teams, larger organisations can implement more sophisticated measurement approaches:
- Weekly: Track real-time dashboards of critical metrics like open positions, offer acceptance rates and turnover in high-priority roles or departments.
- Monthly: Review comprehensive HR scorecards with departmental breakdowns of all key metrics, allowing for rapid identification of outliers and hot spots.
- Quarterly: Conduct statistical analysis of correlations between HR metrics and business outcomes, helping demonstrate the concrete impact of human resources initiatives.
- Annually: Perform predictive analytics on workforce trends, succession planning effectiveness and long-term talent pipeline health.
Whatever schedule you choose, consistency is crucial. When you measure your HR KPIs consistently, you’ll spot seasonal patterns correctly, your leaders will actually use your insights and you’ll build efficient processes that connect HR wins directly to business results.
How to choose the right HR metrics for your organisation
The most effective HR metrics are the ones that support better decisions, not just better reporting.
Link metrics to organisational goals
Start with what the business is trying to achieve. Whether the goal is growth, retention, productivity or cost control, choose metrics that directly reflect progress against those priorities. This keeps HR reporting aligned with business strategy.
Focus on actionable insights
More data isn’t always better. Prioritise metrics that highlight issues early, explain what’s driving outcomes and point to clear next steps. If a metric doesn’t inform action, it’s probably not worth tracking.
Building an HR metrics dashboard and template
An HR metrics dashboard brings your people data together in one place, making it easier to spot trends, track performance and support better decision-making. Instead of relying on static reports, dashboards give leaders a clear, up-to-date view of workforce health.
What a good HR metrics dashboard covers
A well-designed dashboard focuses on a small set of meaningful metrics, grouped into clear sections such as:
- Hiring and recruitment (time to fill, cost per hire)
- Engagement and sentiment (eNPS, survey participation)
- Retention and turnover (voluntary turnover, tenure)
- Performance and development (probation success, training outcomes)
- Productivity and risk (revenue per employee, absenteeism)
This structure makes it easy to understand what’s happening and where action may be needed.
Tools and systems to use
The most effective dashboards draw data directly from your HR and payroll systems, reducing manual work and improving accuracy. HR platforms with built-in analytics (like Employment Hero) can automatically track key metrics, update dashboards in real time and support consistent reporting across teams. For more advanced needs, data can also be combined with finance or performance systems to give a broader business view.
Download the free HR metrics guide
If you’re just getting started, a handy guide can help you prioritise the right metrics and present them clearly.
Download our free HR metrics guide to track key people metrics, support leadership reporting and build a consistent foundation for HR analytics.

Turning HR data into strategic action
Turning HR data into strategic action means moving beyond reporting numbers to using insights that shape decisions and drive change. When HR data is applied deliberately, it empowers leaders to act earlier, invest smarter and align people strategy directly with business outcomes.
Connect metrics to specific HR initiatives
Notice your employee engagement scores dropping in the marketing team? Don’t just present the numbers and hope someone else figures out what to do. Use your data to design targeted interventions. Maybe it’s time for that flexible working pilot program you’ve been considering. Once implemented, track the before-and-after impact regularly.
Make insights accessible to managers
Create simple, visual dashboards that help team leaders understand their people metrics without needing a statistics degree. When managers can easily spot flight risks or skills gaps, they become partners in implementing solutions.
Use predictive rather than reactive analytics
Stop using your HR data just to explain what went wrong last quarter. Run “what-if” scenarios to forecast potential issues before they materialise. When you present proactive solutions to problems that haven’t yet happened, leadership starts seeing HR as genuinely strategic.
Create a feedback loop for HR processes
Use your metrics to continuously improve your own HR functions. If your time-to-hire remains stubbornly high despite multiple interventions, it might be time to completely reimagine your recruitment process rather than make incremental tweaks.
Translate HR metrics into business language
Don’t just report that training hours have increased, show how that additional learning has improved productivity and costly errors have reduced. When HR metrics are framed in terms of revenue impact, cost savings or risk reduction, you dramatically increase leadership buy-in.
Supercharge your HR analytics with Employment Hero
Employment Hero brings your HR data together in one platform, making it easier to track key metrics, uncover insights and report with confidence. With built-in analytics, real-time dashboards and integrated payroll and HR data, you can move from manual reporting to informed, strategic decision-making.
To get started, download our free HR metrics guide and see how Employment Hero can help you turn workforce data into action, faster and with less effort.
Want to learn how Employment Hero can transform your team into a data-driven HR function? Get in touch with us today.
Before you download the guide, we just need some details:
Related Resources
-
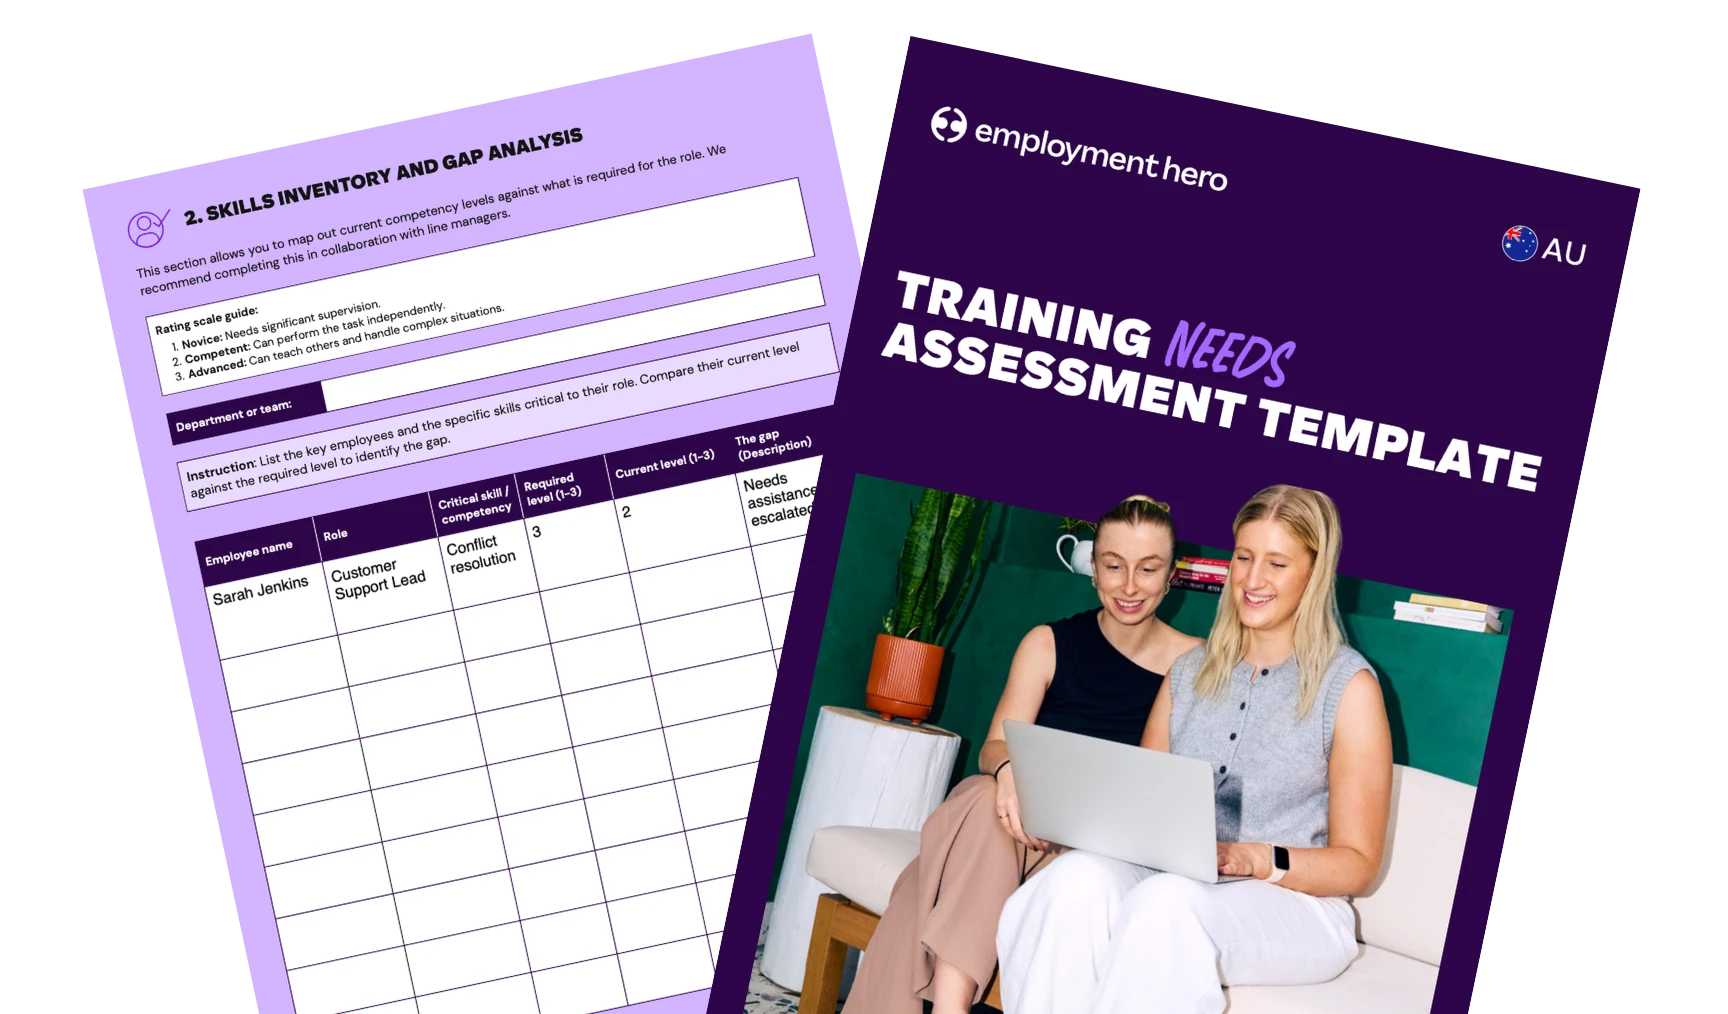 Read more: Conducting a training needs analysis: Free template and guide
Conducting a training needs analysis: Free template and guide
Unlock your team’s potential with a training needs analysis. Learn how to boost employee performance and align training with your…
-
 Read more: Staff engagement plan template and guide
Staff engagement plan template and guide
Discover effective strategies for creating a staff engagement plan that drives results. Download our template and guide.
-
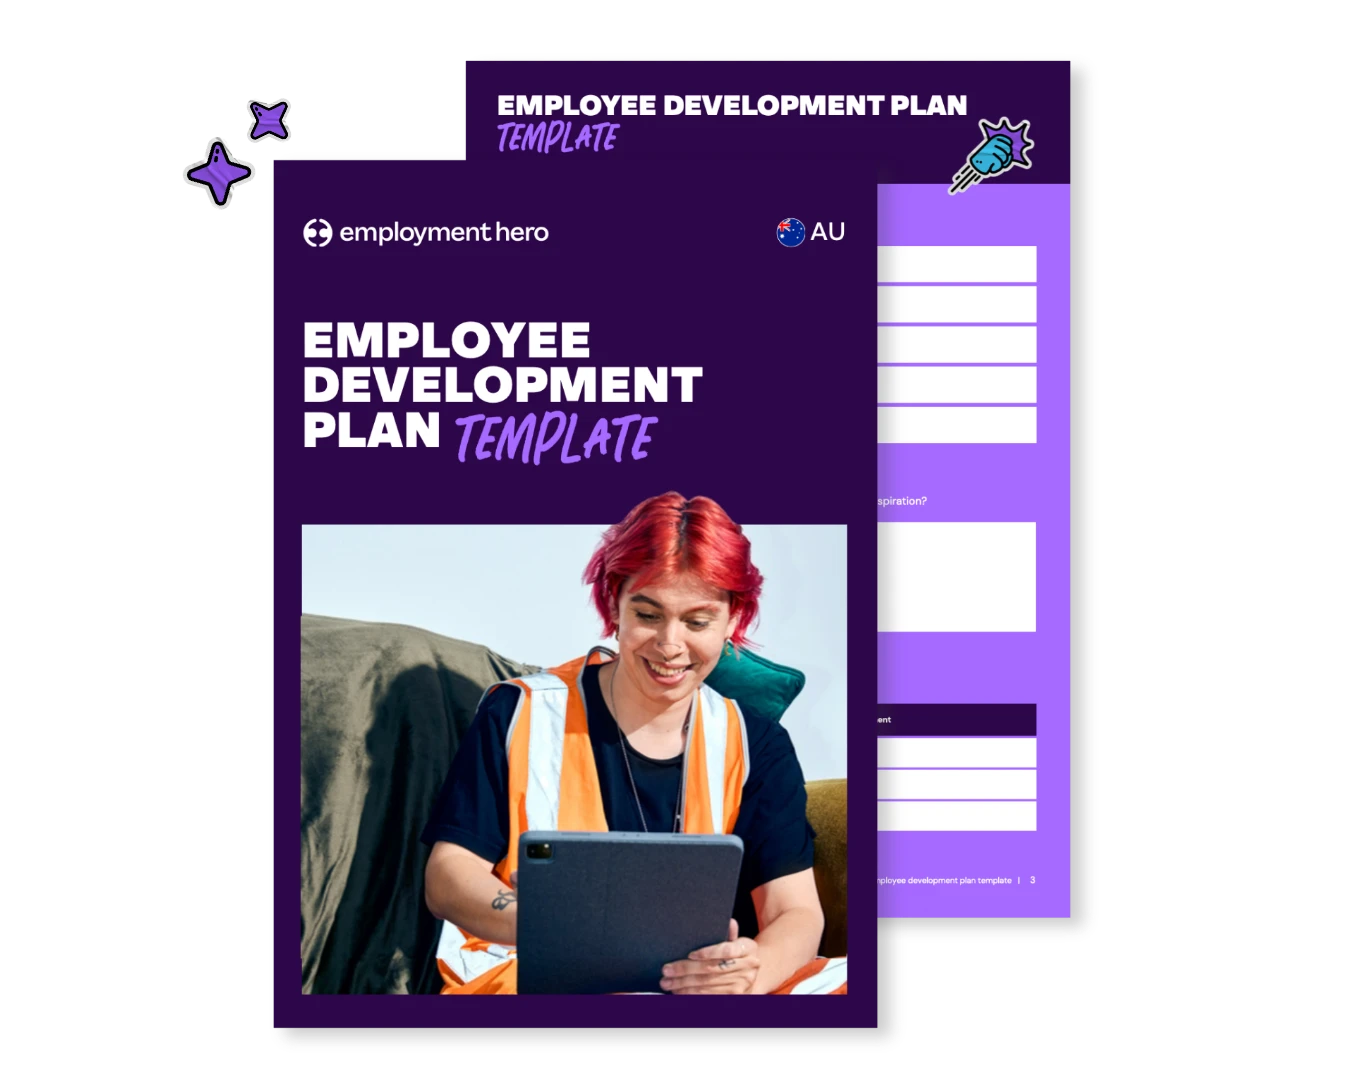 Read more: Employee development plan: Examples and template
Employee development plan: Examples and template
Discover real employee development plan examples, strategic frameworks and a free template to empower growth in your team.