Australia Remote Work Report
Published
Australia Remote Work Report
Where are you working from right now?
Home? The office? The couch? A cafe? A co-working space halfway across the world?
Wherever it may be, there’s a high chance it’s a different location to where you were working three years ago. Most of us have now mastered the art of remote work and it’s become a very normal part of our everyday life.
Beyond the demands of the pandemic, could remote work provide flexibility like no other, soften the rising cost of living, and benefit marginalised groups – helping address important issues affecting Australian workers in 2022?
While we don’t have a crystal ball, we wanted to examine the current state of remote work, and how this might shape working trends. We’ve gathered responses from employees* across Australia to share their sentiments on how remote, hybrid and office working is shaping the future of work.
In this report, we cover:
- How the future of work is flexible;
- Prioritising work-life balance;
- A world of opportunity for everyone;
- Working and the rising cost of living;
- The changing role of automation and digital tools;
- What the future of work will look like; and
- Much more.
Download the report now.
*This report represents a segment we surveyed in the employment market. We are mostly examining data from ‘knowledge workers’, defined as workers with jobs which require them to work primarily on a computer or with documentation, rather than a job which is predominantly physical or location-bound.
Looking for more resources?
If you’re thinking of switching to a remote-first approach to working, here are some helpful resources:
- Implementing a flexible work policy
- How does remote work promote better work-life balance?
- Essential software for remote workers
- The ultimate guide to remote work
- How can you hire globally with an Employer Of Record?
- What is a professional employer organisation?
- Global Employer of Record service provider
- Australian Employee Expectations Report
- Australia’s Financial Wellness in 2023 Report
- What Australian Employees Want in 2022 Factsheet
- Remote Work Policy and Employee Agreement Template
- Remote Onboarding Checklist
Register for the report.
Related Resources
-
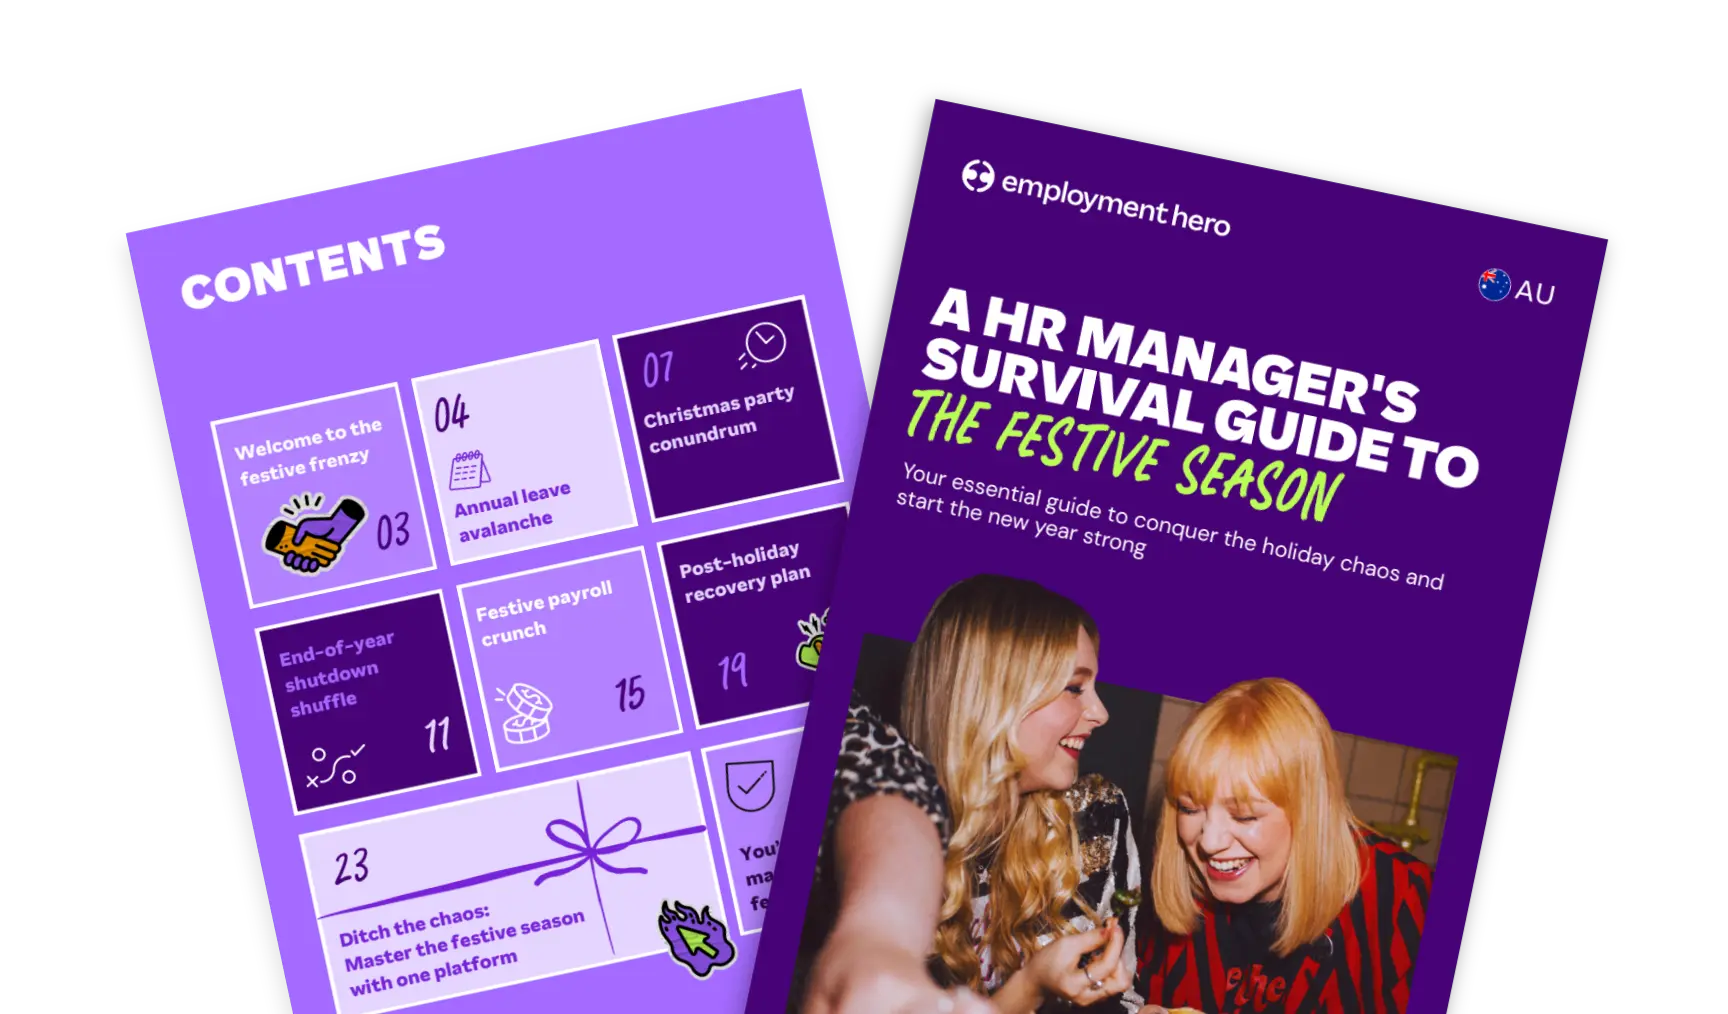
 Read more: HR Managers: Don’t just survive the festive season, master it
HR Managers: Don’t just survive the festive season, master it
Make year-end easier: manage leave, payroll, parties and shutdowns with confidence. Get practical tips for Australian SMEs. Download the free…
-
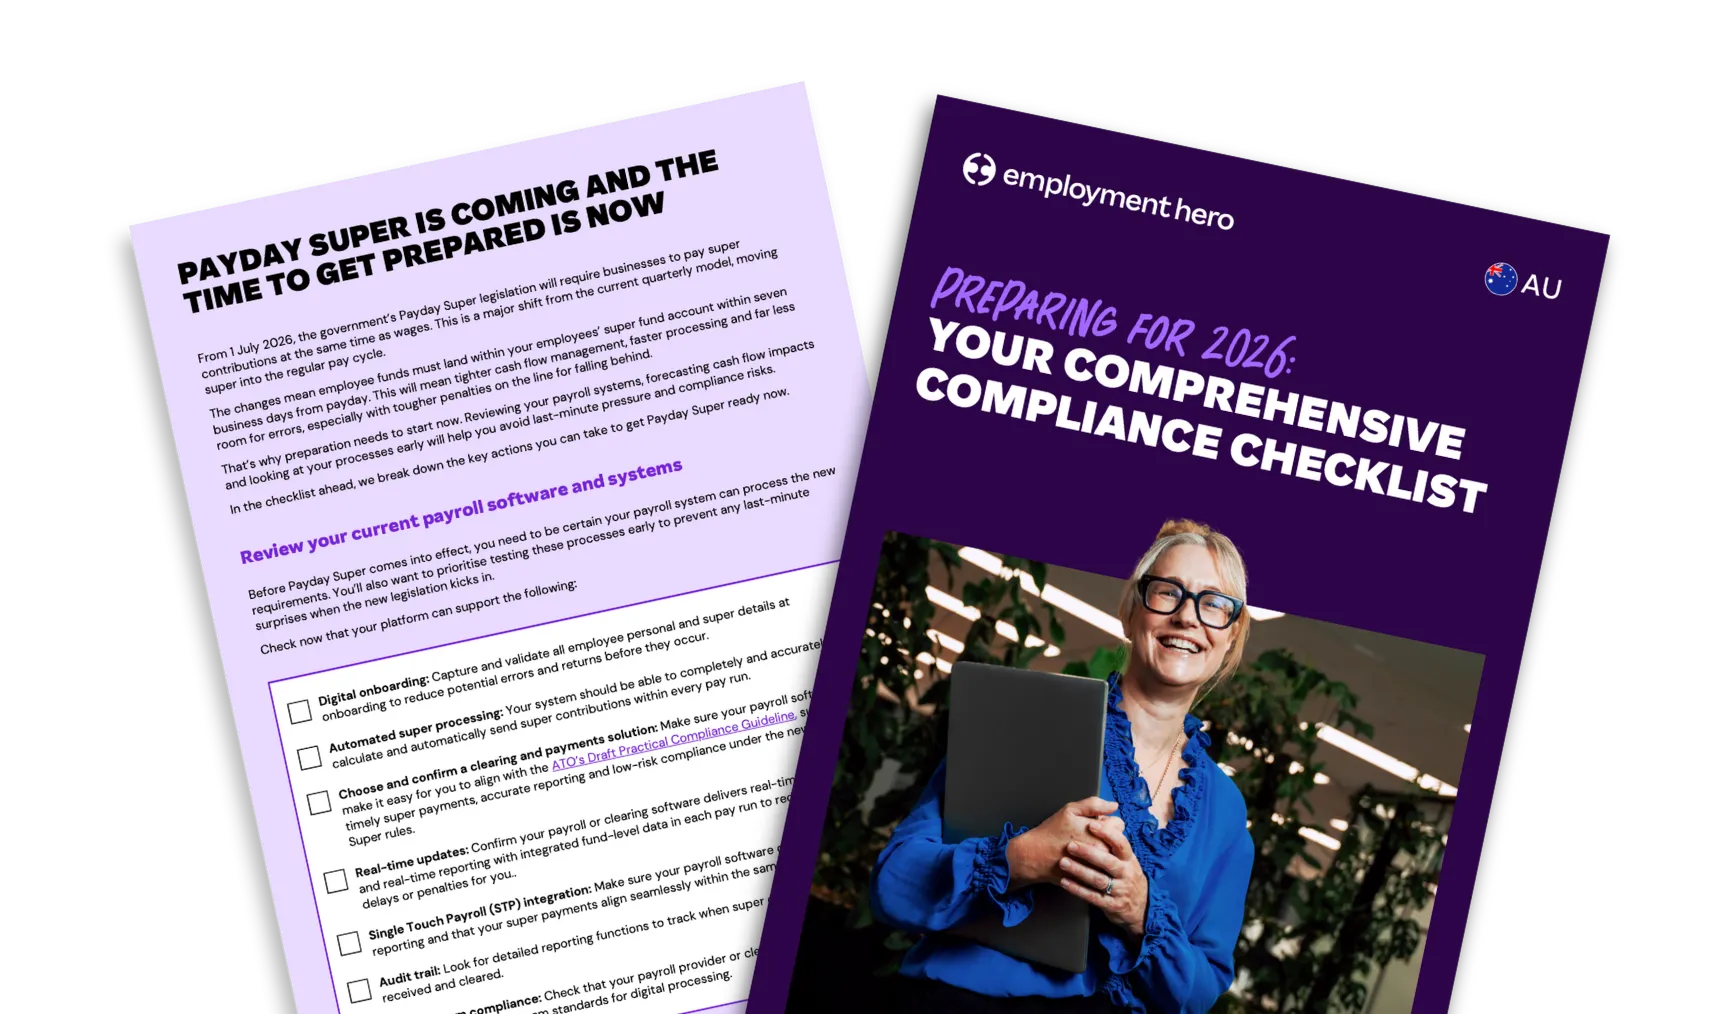
 Read more: Preparing for 2026: Your Compliance Checklist
Preparing for 2026: Your Compliance Checklist
Get your business ready for the 1 July 2026 changes. See practical steps for Payday Super, cash flow planning and…
-
 Read more: Monthly business budget template for employers
Monthly business budget template for employers
Plan your monthly income and expenses with our free monthly business budget template. Download today to track cash flow and…


