


The Chancellor’s Spring Statement promise of disposable income growth will have landed favourably with workers and families across the UK. But Employment Hero’s February Jobs Report reveals a much more complex picture for SMEs.
Tracking real-time figures from 120,532 SME employees and 4,574 businesses, the data show that while wages are rising significantly above inflation at 8.8% year-on-year (YoY) – reflecting SMEs’ position as fair employers competing hard for talent in a tight labour market – business leaders warn the rate of growth is unsustainable in the face of mounting cost pressures.
With SMEs preparing to increase prices to offset these costs, any wage gains or disposable income improvements risk being eroded by higher prices across the economy.
The data paint a picture of an SME sector caught between supporting employees with the cost of living and staying financially viable – a tension that will come to a head in April when National Minimum Wage increases and Employment Rights Act regulations take effect.
U-Shaped Recovery Takes Hold as Wages and Employment Accelerate

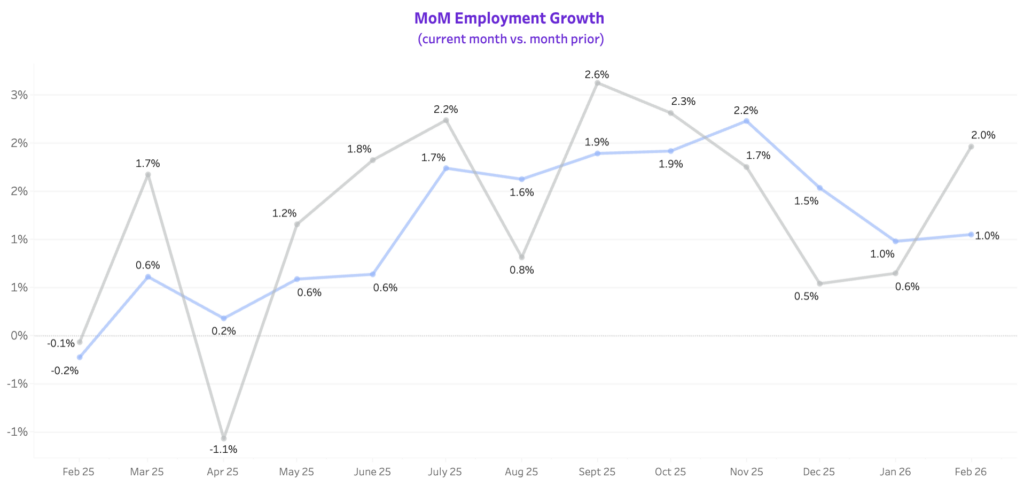
February’s 8.8% YoY wage growth represents a sharp uptick, with employment also up 2.0% month-on-month (MoM) and 4.9% YoY – marking a clear U-shaped recovery after the April 2025 slowdown.
The data marks a turning point in the SME labour market, with both employment and wages accelerating back to pre-April 2025 levels. Whether that level of wage growth is sustainable is another matter, however. With numerous Employment Rights Act measures – such as changes to Statutory Sick Pay and the arrival of the Fair Work Agency – on the horizon, it’s unlikely that SMEs will be equipped to absorb these cost increases indefinitely.
Kevin Fitzgerald, UK Managing Director at Employment Hero points out that while “the resilience of the UK’s small businesses has come through loud and clear in our February figures, the labour market is not out of the woods just yet.”
Adding: “The Employment Rights Act reforms coming into force next month add yet another dimension to an increasingly complex environment for small businesses. It is no surprise that many feel compelled to hike prices as they navigate yet more red tape. There is a clear need to provide greater support to small businesses, which form the backbone of the UK labour market.”
The North and East Lead UK Wage Growth at Over 12%
Looking at the regional picture, there are big differences between what’s happened over the past month and what’s played out over the past year. The East leads MoM wage growth at 4.0%, followed closely by the Midlands at 3.9%, while London posted 3.5% MoM growth. In the North and South, monthly increases were more subdued at 1.0% each.
However, looking at YoY figures, the North commands the highest annual wage growth at 12.5%, with the East close behind at 11.9%. The Midlands sits at 9.0% YoY, while the South (5.3%) and London (4.0%) lag significantly behind their regional counterparts.
Wage growth also varies dramatically depending on how far back you look. London’s relatively strong month-on-month performance (3.5%) but weak annual growth (4.0%) suggests the capital’s wages were flat or falling through much of 2025 and are only now picking up speed. The North, by contrast, has seen steady, consistent wage increases building over the past year – the region’s 12.5% annual figure reflects sustained pressure rather than a sudden February spike.
The East stands out with strong growth on both measures: 4.0% month-on-month and 11.9% YoY. It’s a pattern that’s mirrored in the region’s employment figures, which show a remarkable 17.4% YoY increase in headcount. Put simply, small businesses in the East are both hiring aggressively and paying significantly more to attract talent – a combination that’s driving intense cost pressures for local employers.
Where businesses are actually hiring
Regional employment patterns reveal further nuance. While The East leads on annual employment growth (17.4% YoY), its month-on-month employment actually dipped slightly (-0.2%), suggesting the hiring boom may be plateauing. Scotland and the South both show healthy 4.5% YoY employment growth with strong monthly momentum (2.7% MoM each), while London’s 2.9% MoM growth translates to just 2.2% annually. The North, despite commanding the highest wage growth, shows modest employment expansion at just 0.5% YoY – suggesting businesses there are raising pay for existing staff rather than expanding headcount significantly.
These regional differences reflect the varying intensity of talent competition across the UK. SMEs in the North and East are proving themselves competitive employers in tight local labour markets, but they’re also locked into a wage arms race that many can’t sustain long-term. Both regions are home to businesses that act as anchor employers in their local economies, where the cost of losing talent to competitors – or failing to hire at all – outweighs the pain of wage increases.
How different age groups are faring
The generational picture adds another layer. Across all age groups, wages are rising significantly: Gen Z workers have seen 9.7% YoY growth, Gen Y (Millennials) are up 7.7%, and Boomers are tracking the national average at 8.8%. But it’s Gen X workers – typically in their 40s and 50s – who are commanding the highest increases at 10.8% YoY.
While the reasons may vary, the figures suggest SMEs are placing a premium on experienced professionals who can navigate increasingly complex regulatory environments, particularly as businesses prepare for April’s compliance challenges.
Looking at MoM momentum tells us where wage pressure is building fastest. Gen Z leads with 2.7% MoM wage growth, followed by Gen X at 2.1%, Boomers at 1.6%, and Gen Y bringing up the rear at 1.5%. The fact that Gen Z is seeing the strongest monthly increases alongside near-double-digit annual growth (9.7%) suggests younger workers are gaining bargaining power in the current market – possibly because they’re more mobile and willing to switch jobs for better pay.
Gen Z hiring surges as Boomers exit the workforce
The employment data reinforces this story. Gen Z employment is up 10.9% YoY – the strongest growth of any generation. Gen Y and Gen X both show modest 2.9% YoY employment growth. But the most striking figure is for Boomers: employment has fallen -5.8% YoY, even as their wages have risen 8.8%. This suggests older workers are leaving the workforce – whether through retirement or other factors – while those who remain are being rewarded with competitive pay increases to retain their expertise.
On a month-to-month basis, Boomers saw the strongest employment growth in February at 4.4% MoM, followed by Gen X at 2.0%, Gen Y at 1.7%, and Gen Z at 0.8%. The sharp contrast between Boomers’ strong monthly performance (4.4% MoM) and declining annual trend (-5.8% YoY) suggests this cohort experienced significant job losses earlier in 2025 and is only now seeing some recovery.
Strategic Steps for Managing Cost Pressures
With National Minimum Wage rising to £12.71, Employment Rights Act regulations taking effect over the next few years, and continued wage pressure across the board, the ultimate test as to whether SMEs will be able to rebuild their workforces and continue to compete for talent – or else move into defensive cost management mode – remains to be seen.
Given the scale of challenges facing SMEs, here are some practical steps business leaders can take to navigate the months ahead:
Model the April impact
Calculate the combined effect of NMW increases and ERB compliance on your specific cost base. Many businesses are underestimating the cumulative impact.
Review pricing strategy now
With price increases likely across the SME economy, assess whether you can pass costs to customers without losing competitiveness.
Invest strategically in compliance
The 16.4% wage growth for HR roles signals this expertise is now essential. Evaluate whether building internal capability or engaging external specialists offers better value.
Benchmark regional pay
If you’re in the North or East, 12.5% and 11.9% YoY growth represent competitive benchmarks – but also highlight the sustainability challenge.
Plan for full-time hiring competition
The 13.4% surge in full-time roles indicates where talent competition is fiercest. Make sure what you offer employees – from benefits and flexibility to career development – extends beyond salary alone.