


UK Minimum Wage: A Complete Guide to Rates, History and Living Costs (1999 to 2025)
-

Rachel Smith
Contents
The UK minimum wage has been one of the most significant labour policies of the past 25 years, but has it really delivered what workers and employers need?
Pay trends aren’t just numbers on a spreadsheet. For employees, they shape financial security and quality of life. For employers, they affect hiring costs, retention and competitiveness. For policymakers, they are a tool to address inequality and support economic stability.
This guide takes a clear-eyed look at how the minimum wage has developed since 1999, how it stacks up against the rising cost of living, and why the story looks very different depending on where you live in the UK. We’ll also explore what’s next and what it all means for employers trying to balance fairness, compliance and profitability.
UK Minimum Wage: A brief history (1999 to Present)
1999 to 2009: The foundation years
The National Minimum Wage (NMW) was introduced in April 1999 at £3.60 per hour for adults over 22. At the time, it was seen as a bold move to reduce in-work poverty. Business groups pushed back, warning of job losses, but those fears didn’t materialise. Instead, early studies showed limited impact on employment and meaningful gains in earnings.
But while the policy lifted many pay packets, it didn’t level the playing field. Living costs rose rapidly, particularly in housing and transport. Workers in London and the South East quickly saw wage gains swallowed up by rent. Meanwhile, in lower-cost regions like the North East and Wales, the minimum wage went further highlighting a divide that’s still with us today.
For employers, the new wage floor brought stability but also forced tough conversations about pricing, hiring and productivity. Those same conversations are still happening now. The difference is, today, employers have access to payroll automation and workforce planning tools that can help manage wage pressures more strategically.
2010 to 2015: A period of stagnation
The aftermath of the 2008 financial crisis left wage growth stuck. Between 2010 and 2015, the minimum wage only rose by £1.08. Meanwhile, everyday costs like rent and energy soared. Many full-time workers slipped into in-work poverty and employers faced squeezed margins and subdued demand.
Small businesses relied more on zero-hours contracts and casual hiring to stay flexible. Automation crept in, with self-checkouts and fast-food kiosks beginning to reshape low-wage roles.
| Year | Adult Minimum Wage | Average Weekly Rent (England) | Average Annual Energy Bill | Food Price Inflation (year-on-year) |
|---|---|---|---|---|
| 2010 | £5.93 | £149 | £1,040 | +3.4% |
| 2012 | £6.19 | £168 | £1,250 | +4.1% |
| 2014 | £6.50 | £181 | £1,345 | +1.9% |
| 2015 | £7.03 | £190 | £1,300 | +0.5% |
Sources: ONS Annual Survey of Hours and Earnings; UK Housing Survey; Ofgem historic energy price data; ONS Consumer Price Inflation
Luckily, modern recruitment software can help businesses optimise hiring decisions and manage workforce planning more strategically, reducing reliance on precarious contracts.
2016 to 2019: The National Living Wage era
A major policy shift came in 2016 with the introduction of the National Living Wage (NLW), initially set at £7.20 an hour for workers aged 25 and over. The government promoted this as a bold step to boost living standards, branding it a ‘Living Wage’ in name. However, the Living Wage Foundation quickly criticised the policy, arguing that the NLW was not truly reflective of the real costs of living, particularly in high-cost regions like London.
The voluntary Real Living Wage (RLW), calculated annually based on rent, food, transport and utility costs, was consistently higher. For example:
| Year | National Living Wage (25+) | UK Real Living Wage | London Living Wage |
|---|---|---|---|
| 2016 | £7.20 | £8.25 | £9.40 |
| 2017 | £7.50 | £8.45 | £9.75 |
| 2018 | £7.83 | £8.75 | £10.20 |
| 2019 | £8.21 | £9.00 | £10.55 |
Sources: UK Government (HMRC) National Minimum & Living Wage Rates Archive; Living Wage Foundation annual reports (2016–2019)
Employers responded in mixed ways: some cut hours, others invested in tech, while forward-thinking businesses started using non-pay benefits like flexible work and wellbeing support to attract staff.
2020 to 2023: COVID-19 and the economic squeeze
The arrival of the COVID-19 pandemic in 2020 reshaped the UK labour market. The pandemic showed how many workers depended on minimum or near-minimum pay and millions of jobs were temporarily protected by the furlough scheme,
In 2021, the National Living Wage (NLW) was extended to workers aged 23 and over, broadening its reach. Yet wage growth during this period was quickly overtaken by rising costs. By 2022, the UK entered a full-scale cost of living crisis, with inflation peaking at over 11%, the highest in four decades.
| Year | NLW (23+) | Average Weekly Rent (England) | Average Annual Energy Bill | CPI Food Inflation (year-on-year) |
|---|---|---|---|---|
| 2020 | £8.72 | £201 | £1,200 | +1.5% |
| 2021 | £8.91 | £207 | £1,277 | –0.3% |
| 2022 | £9.50 | £213 | £2,500+ (post-cap rise) | +9.8% |
| 2023 | £10.42 | £220 | £2,074 (after gov. support) | +11.5% |
Sources: ONS Annual Survey of Hours and Earnings; UK Housing Survey; Ofgem forecasts; ONS Consumer Price Inflation; Employment Hero projections (2025)
2024 to Present: Record increases but is it enough?
In April 2024, the National Living Wage rose to £11.44 per hour for workers aged 21 and over–the largest single increase in its history. This positioned the UK as having one of the highest statutory wage floors among developed economies.
But the real question: does it go far enough? Rising housing, food and transport costs — especially in London and the South East — mean pay packets are still being stretched thin.
Below the table shows that the average proportion of net household income spent on housing costs is climbing across all tenures including, renters, mortgagors and even outright owners. For low-wage workers, this means pay increases risk being immediately consumed by higher housing costs.
| Year | NLW (21+) | Average Weekly Rent (England) | Average Annual Energy Bill | CPI Food Inflation (year-on-year) |
|---|---|---|---|---|
| 2024 | £11.44 | £230 | £1,928 | +6.0% |
| 2025* | £12.21 | £240 (proj.) | £1,849 (Ofgem cap) | +3.2% (proj.) |
Sources: ONS, Ofgem, EH Projections; some 2025 figures projected
For employers, higher wage obligations are accelerating two distinct responses:
- Some small businesses are cutting jobs, raising prices or narrowing operations to cope with wage inflation.
- Others are turning towards automation and productivity investments, seeing higher wage floors as a catalyst for modernisation.
At the same time, many employers are expanding non-pay benefits to retain staff. Flexible hours, hybrid work models, wellness stipends and even free meals are increasingly offered, reflecting recognition that pay alone cannot offset the cost-of-living squeeze.
National Minimum Wage & National Living Wage
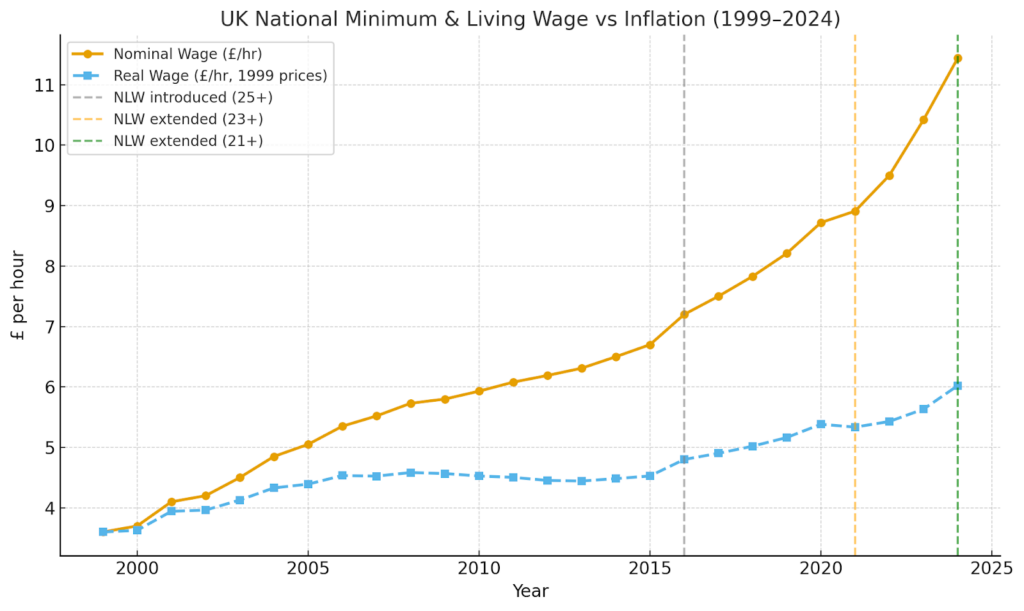
The graph tracks the UK National Minimum Wage (1999–2015) and National Living Wage (2016–2024) against inflation, showing both the nominal value (actual hourly rate paid) and the real value (adjusted for inflation back to 1999 prices). On paper, wages have risen steadily from £3.60 in 1999 to £11.44 in 2024, more than tripling in 25 years.
However, when adjusted for inflation, the picture is more uneven. The real value of the minimum wage grew during the early 2000s but stalled after the 2008 financial crisis, with purchasing power eroded by rising living costs. The 2010s saw only modest real-term gains, as wage increases struggled to keep pace with housing, food and energy prices. The cost-of-living crisis in 2022–23 created another sharp squeeze, with real wages dipping despite record nominal increases.
This illustrates a key challenge: while the statutory wage floor has reached historic highs in nominal terms, workers’ actual spending power has not consistently improved. The gap between the headline rate and everyday affordability highlights why debates around the Real Living Wage, housing costs, and regional disparities remain central to wage policy in the UK.
Salary vs cost of living
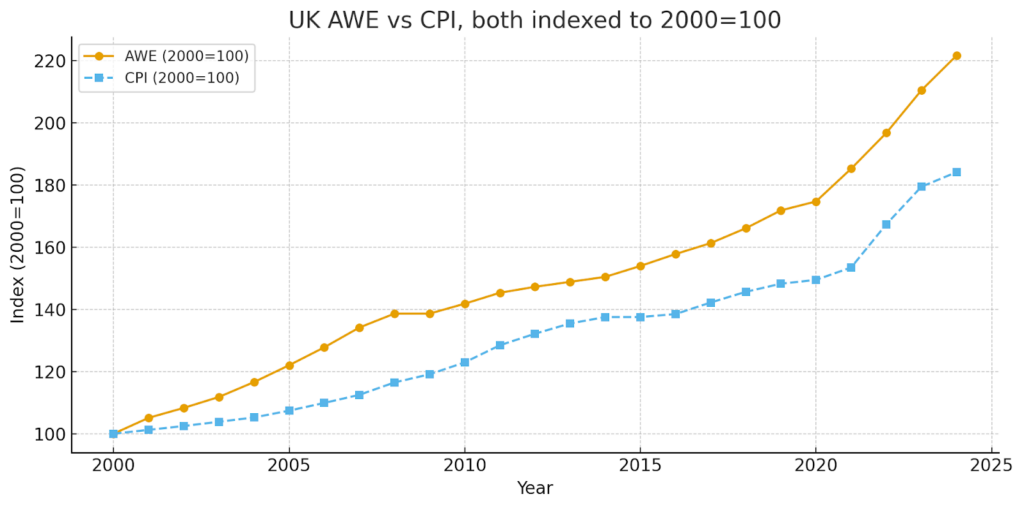
The graph comparing UK Average Weekly Earnings (AWE) and the Consumer Price Index (CPI) from 2000 to 2024 highlights the close relationship between wages and the cost of living. Both series move almost in lockstep, with a correlation of around 0.99, showing that earnings and prices tend to rise together. When indexed to the year 2000, earnings have grown by about 122%, while CPI has risen by roughly 85%, suggesting that, in nominal terms, wages have outpaced inflation over the long run.
However, the picture is less even when broken down by sub-periods: earnings stagnated relative to inflation in the years after the 2008 financial crisis, only to accelerate more strongly in the past few years as pay growth surged during and after the pandemic while inflation also spiked.
The indexed comparison makes clear that although workers are somewhat better off in real terms than in 2000, the gains have been uneven and concentrated in recent years rather than spread consistently across the whole period. Employers and HR teams often turn to salary benchmarking to understand how pay trends align with market expectations and ensure competitiveness.
Regional wage comparison
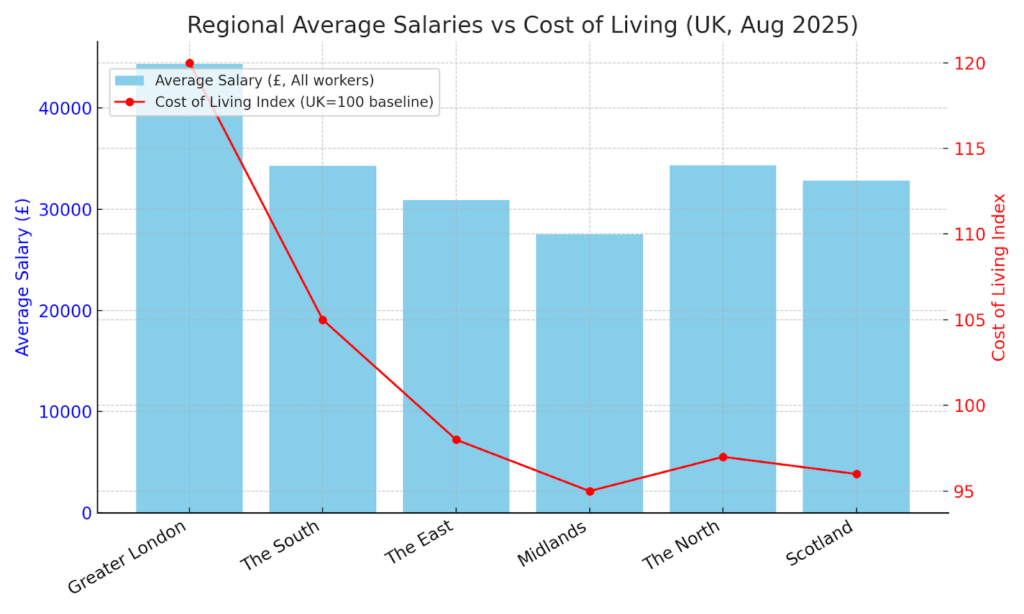
The picture of wage growth across the UK in 2025 reveals stark contrasts between regions, with cost-of-living pressures continuing to shape the real value of earnings. Looking at year-on-year changes (based on a three-month rolling average to August 2025), we see the North leading the way with an 11.6% increase in wages, followed closely by the East (+9.7%) and Scotland (+6.2%). The Midlands recorded a more modest rise of 3.7%, while Greater London saw only a 2.0% uplift despite its high wage base. In contrast, the South slipped into negative territory with a -2.5% decline, suggesting households there may be feeling a sharper squeeze when set against persistent housing and transport costs.
When it comes to pay levels, London remains by far the highest-paying region, with an average salary of £44,397 across both full- and part-time roles, and £50,922 for full-time workers. By comparison, the South averages £34,313 (£41,999 full-time), while the East and the North cluster around the £30,000–£39,000 range. Scotland and the Midlands sit slightly lower at £32,838 (£37,682 full-time) and £27,515 (£35,518 full-time) respectively. This demonstrates a persistent regional pay gap that continues to shape economic opportunity and mobility.
But these figures only tell part of the story. When crossed with cost-of-living measures such as housing, transport, and energy, regional disparities sharpen. For instance, London’s high salaries are significantly eroded by the capital’s steep housing costs, leaving workers with far less disposable income compared to counterparts in cities like Newcastle or Manchester, where salaries are lower but the cost of living is substantially more manageable.
Overlaying this with the Real Living Wage movement provides further insight. Adoption hotspots are emerging in places such as Greater Manchester, Salford, Birmingham, Cardiff, Edinburgh, Bristol, Norwich, Sunderland, Aberdeen, Dundee, and London’s Royal Docks in Newham. These “Living Wage Places” initiatives aim to address in-work poverty by ensuring more local employers commit to paying a voluntary rate based on actual living costs—£12.60 across the UK and £13.85 in London as of 2025. Uptake is particularly strong in major cities where local authorities and anchor employers have mobilised, helping offset the pressure of inflation on the lowest-paid.
Together, the data and the Living Wage hotspots underscore a two-speed economy: one where nominal wage growth may look strong in some regions but fails to keep pace with rising costs, while in others, proactive adoption of fair pay standards is helping to secure real improvements in workers’ day-to-day lives.
Future outlook: What comes next?
The National Living Wage (NLW) has already crossed the £12 milestone, rising to £12.21 in April 2025. Current projections suggest it will climb further to around £12.71 in April 2026, with a possible range between £12.55 and £12.86. Beyond that, the government has moved away from fixed targets and instead pledged to keep the NLW at no less than two-thirds of median earnings. If wage growth develops as forecast, that could place the NLW at roughly £13.00 by April 2027, though this remains illustrative rather than guaranteed.
Yet these headline figures mask deeper challenges. According to the Resolution Foundation’s Living Standards Outlook 2025, household incomes in 2024–25 are no higher than they were in 2019–20, while food insecurity at the start of 2025 remains twice as high as in 2021. This highlights a sharp tension; even as the statutory minimum has risen, wages haven’t kept pace with real living costs, leaving many low-income workers struggling to make ends meet.
Government policy has shifted towards embedding the principle of linking the NLW to earnings, while also asking the Low Pay Commission (LPC) to consider cost-of-living pressures. There is also a push to phase out discriminatory age bands, with a review underway on how to merge or narrow rates for younger workers. These moves are part of an ambition to make the minimum wage a ‘genuine living wage’, but the reality is more complex.
On the ground, businesses face rising costs and tight margins, and many employers argue they need stronger government support to afford higher wage bills. At the same time, workers on minimum pay often still experience in-work poverty and financial insecurity, undermining the promise that a job should provide a decent standard of living. Critics also point to the regional gaps that one-size-fits-all policies ignore: the cost of living in London or the South East is far higher than in other parts of the UK, yet wage floors remain uniform nationwide.
Looking ahead, the pace of future increases will depend heavily on the economy. Slowing inflation and weaker pay growth could temper uplifts, while persistent cost pressures might push them higher. But whatever the trajectory, it’s clear that minimum wage policy cannot be the only lever. A lasting solution requires a broader strategy; better jobs, stronger skills, fairer work practices, and a more balanced economy, rather than short-term political wins. As for the Real Living Wage, set independently by the Living Wage Foundation, it remains voluntary. The government has not signalled any intention to make it mandatory, preferring instead to adjust the NLW framework to factor in cost of living while maintaining flexibility.
Stay compliant, competitive and ahead with Employment Hero
Ready to take the guesswork out of rising wage costs?
With Employment Hero, you can automate payroll, stay compliant with changing minimum wage laws, and give your people access to benefits that go beyond pay. From earned wage access to flexible work tools, we help you build a workplace where employees feel valued and stay for the long run. Discover Employment Hero today.
FAQs
As of April 2025, the National Living Wage (NLW) is £12.21 per hour for workers aged 21 and over. Lower rates apply for younger workers and apprentices, though the government has begun phasing out age bands to reduce inequalities.
The National Minimum Wage/National Living Wage is a statutory rate set by the government and enforced by law. By contrast, the Real Living Wage is a voluntary rate calculated by the Living Wage Foundation based on the actual cost of living. Employers who choose to pay it commit to going beyond the legal minimum to support their staff.
Yes, though this is changing. In 2025, the top rate of £12.21 applies to everyone aged 21 and over. Lower rates exist for 18–20 year olds, under-18s, and apprentices. However, the government has asked the Low Pay Commission to review these bands, with the goal of eventually merging or narrowing them so younger workers aren’t unfairly penalised.
Yes. All employers are legally required to pay the relevant minimum wage rate to eligible workers, and enforcement is carried out by HMRC. Employers can voluntarily pay the Real Living Wage, but there is no legal obligation to do so.
Related Resources
-
 Read more: Notice of termination of employment UK
Notice of termination of employment UK
Need to issue or respond to a notice of termination of employment? Use our employer-focused checklist covering notice periods, resignation…
-
 Read more: Time off for dependants: A guide to dependency leave
Time off for dependants: A guide to dependency leave
Dependency leave gives employees time off to care for dependants during emergencies. Learn more about your employer responsibilities in this…
-
 Read more: Back to Business: UK Employment Law Updates for Autumn
Back to Business: UK Employment Law Updates for Autumn
Stay ahead of 2025’s UK employment law changes. Join Employment Hero’s expert webinar to learn what’s new, what’s next, and…